Explore how to create pivot tables in Google Sheets, including limitations you should be aware of.

Key takeaways
To create a pivot table in Google Sheets, you take steps such as highlighting your data, adding your categories, and formatting the table.
- You can use pivot tables to organize aspects of your personal life, such as managing a budget, creating guest lists for social occasions, and tracking your fitness goals.
- Google Sheets limits pivot tables to analyzing data within a single sheet and lacks advanced calculation options.
- You can use data visualization tools or other specialized software if you require more advanced customizations or visualizations.
What is a pivot table in Google Sheets?
Pivot tables in Google Sheets are a dynamic tool that can help you get essential data insights while also summarizing and analyzing information. By grouping and summarizing data, pivot tables provide a clear overview of patterns, trends, and relationships within your data.
What is a pivot table used for?
When working in the finance industry, you can use a pivot table to create financial performance reports, identify trends, and make data-based recommendations to your employers. The retail sector utilizes pivot tables to understand consumer behavior and improve marketing plans. You can also use pivot tables to organize aspects of your personal life, such as managing a budget, creating guest lists for social occasions, and tracking your fitness goals.
Steps to create a Google Sheets pivot table
When creating a pivot table in Google Sheets, you will follow these steps:
- Open your Google Sheet.
- Highlight your data.
- Go to Insert > Pivot table.
- Create your pivot table.
- Drag and drop the categories to include in your pivot table.
- Format your pivot table.
Now, let’s go further into each step.
1. Open Google Sheets.
Open your Google Sheets in your web browser.
2. Select your data.
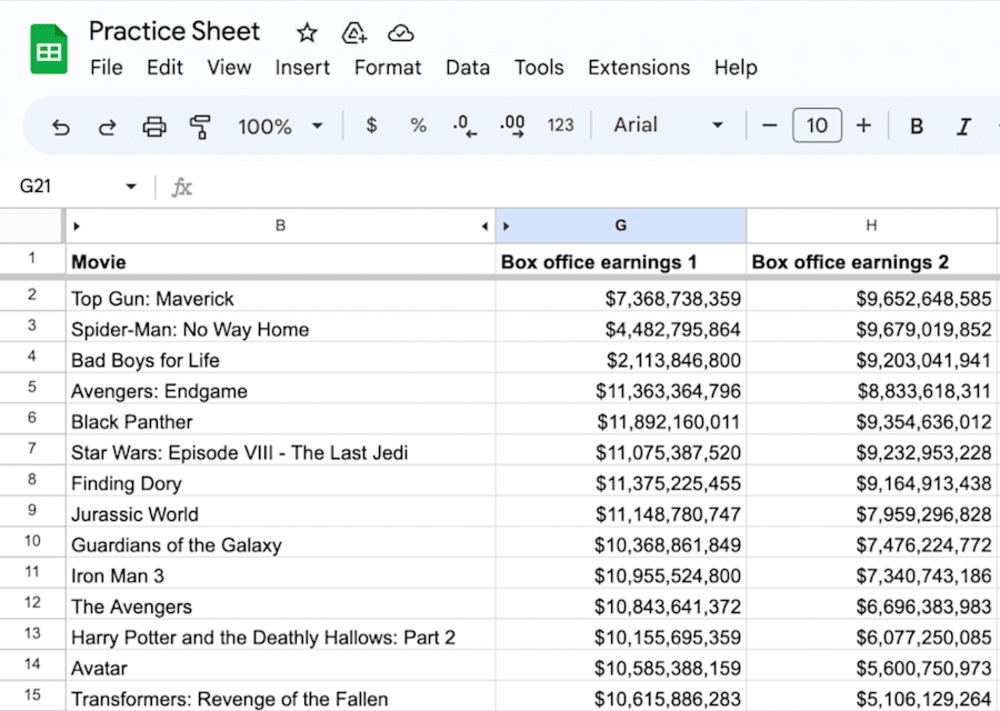
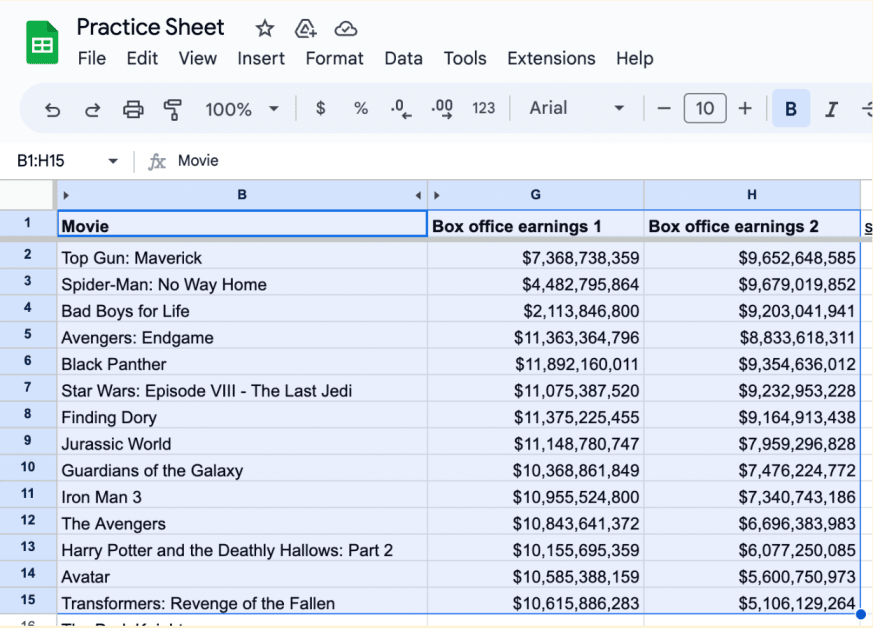
Next, check that your data is organized in columns and rows with headers in the first row. Each column should have a clear heading that describes the data it contains.
Select the range of cells that contains your data. Ensure you’ve chosen all the columns you want to include in your analysis. It’s essential to select the entire data range, including headers.
3. Access the “Pivot table” option in the “Insert” menu.
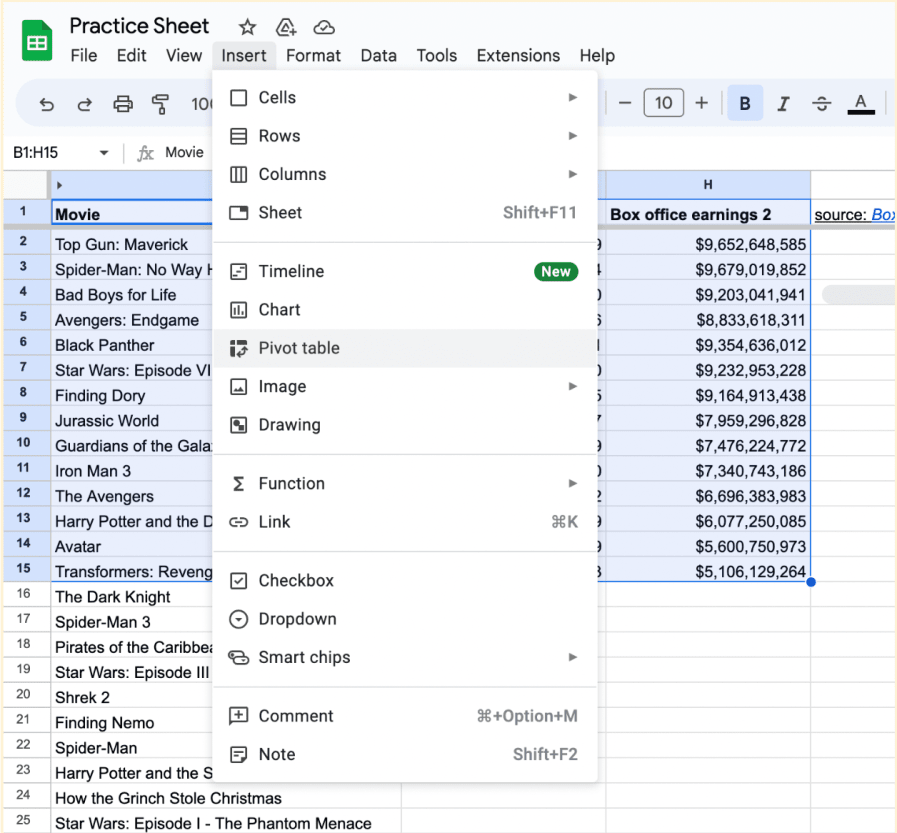
Once you have selected the data range, click on the Insert menu at the top and choose Insert > Pivot table.
professional certificate
Get on the fast track to a career in Data Analytics. In this certificate program, you’ll learn in-demand skills, and get AI training from Google experts. Learn at your own pace, no degree or experience required.
Data Storytelling, Tableau Software, Ggplot2, Spreadsheet Software, Data Analysis, Data Presentation, Sampling (Statistics), Data Cleansing, R (Software), Web Presence, Object Oriented Programming (OOP), File Management, Data Ethics, Data Validation, Data Processing, Interviewing Skills, Rmarkdown, Data Visualization, Data Structures, Stakeholder Communications, Data Transformation, SQL, Data Integrity, Analytics, Sample Size Determination, Data-Driven Decision-Making, Analytical Skills, Data Sharing, Data Visualization Software, Analysis, Python Programming, NumPy, Pandas (Python Package), Code Reusability, Scripting, Programming Principles, Data Manipulation, Computer Programming, Dashboard, Data Entry, Communication Strategies, Problem Solving, Expectation Management, Generative AI, Branding, AI literacy, Google Gemini, Pivot Tables And Charts, Query Languages, Data Quality, Data Collection, Data Integration, Case Studies, Artificial Intelligence, Dashboard Creation, Presentations, Data Security, Unstructured Data, Databases, Data Access
4. Create your pivot table.
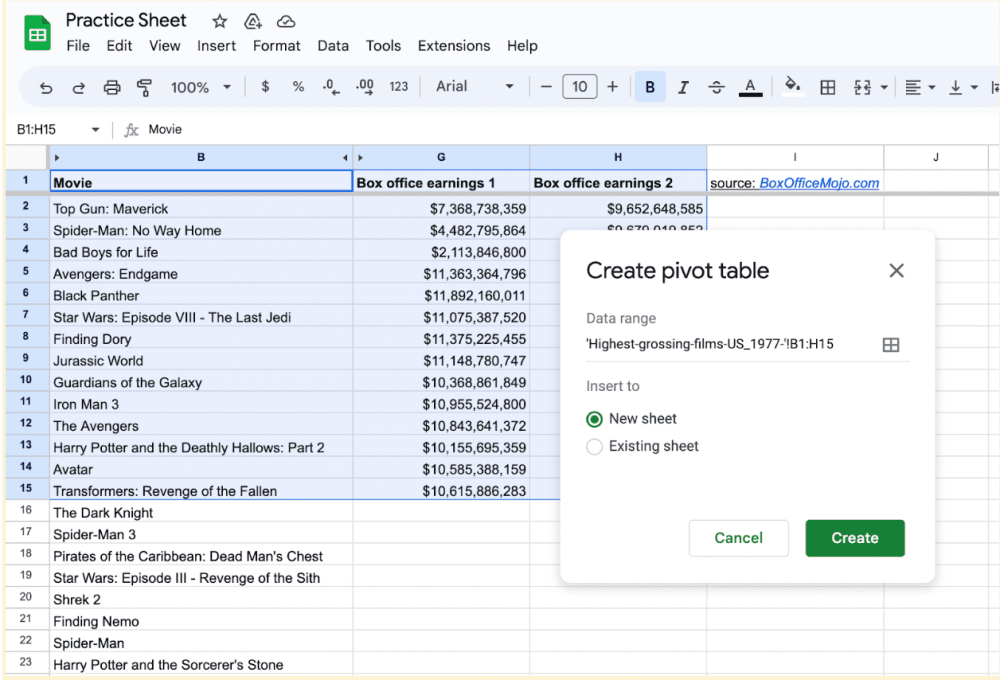
Once you click Insert > Pivot table, an editor will open. You can select “New Sheet” or “Existing Sheet” as the placement for your pivot table. You can also edit the data range included. In this example, we will opt to add our pivot table to the new sheet.
5. Configure your pivot table.
In the pivot table editor, you’ll see several sections: Rows, Columns, Values, and Filter. Drag and drop the headers from your data on the right into the respective sections based on how you want to analyze and summarize your data.
- Rows: Choose the column headers you want to group and display as rows in the pivot table.
- Columns: Select the column headers you want to group and display as columns in the pivot table.
- Values: Choose the column headers containing the data intended for summarizing. You can select different aggregation functions, such as sum, count, average, or custom formulas.
- Filter: Add filters to narrow down the data included in the pivot table based on specific criteria.
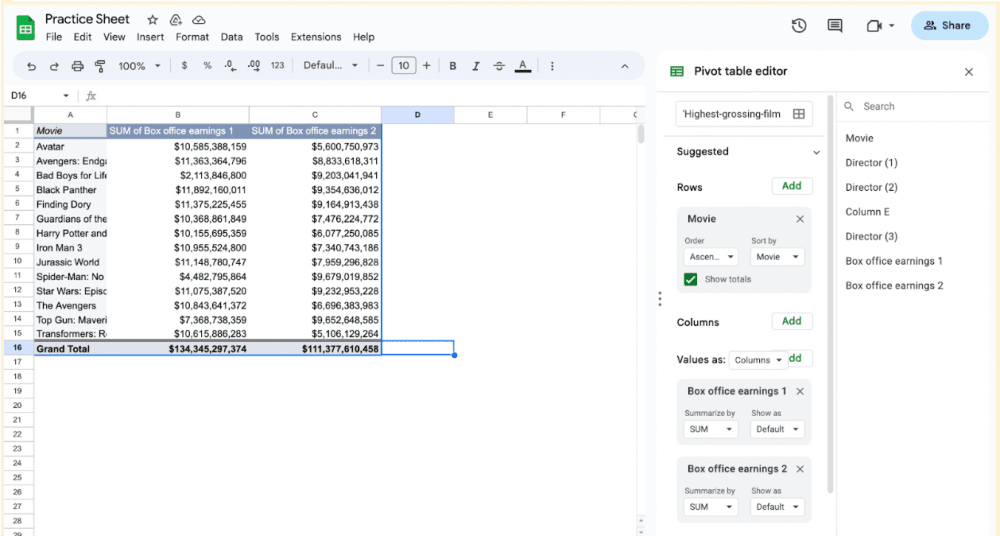
6. Customize your pivot table.
Customize your pivot table to enhance its readability and insights. You can experiment with different configurations, such as rearranging row and column headers or changing your aggregation functions in the Value section.
Limitations and alternatives
While pivot tables in Google Sheets are powerful data analysis and summarization tools, it’s important to be aware of their limitations. Consider the following factors:
- Limited to a single sheet: Google Sheets limits pivot tables to analyzing data within a single sheet. If your data is spread across multiple sheets, you may need to consolidate it into a single sheet before creating a pivot table.
- Lack of advanced calculations: If you require statistics beyond what Google Sheets or Excel can provide, consider using dedicated statistical software or scripting languages like R or JavaScript.
- Limited customization: Consider using data visualization tools like Looker Studio or other specialized software if you require more advanced customization or visualizations.